Hey, Phoenix homeowners and potential buyers! Ready for your weekly real estate check-in? Here’s the news, listings, open houses, events and more! Reach out if you have any specific questions! I’ve enjoyed several conversations this week with friends, colleagues and clients looking for next steps. Enjoy!
Phoenix-Area Real Estate News
The State of Mortgage Payments: A beacon of positive news emerges as serious delinquencies on home loans hit a 17-year low in October, as reported by Black Knight Financial Services. Despite a slight uptick in national foreclosure starts, they remain 25% below pre-pandemic levels, indicating a robust market.
Maricopa County Foreclosure Check: A quick glance at the pending foreclosures in Maricopa County reveals a reassuring scenario. With numbers staying below 1,000, a notably low figure for a county of this size, the local real estate market appears steady.
Affidavit of Value Analysis: The recently analyzed (December 5) Affidavit of Value recorded during November sheds light on various aspects of the market:
- Closed Transactions:
- Total closed transactions: 4,887, down 8% from November 2022 and 12% from October.
- Closed new homes: 1,220, down 11% from November 2022 and 18% from October.
- Closed re-sale transactions: 3,667, down 8% from November 2022 and 10% from October.
- Median Sales Prices:
- Overall median sales price: $465,000, up 2.2% from November 2022.
- Re-sale median sales price: $447,000, up 4.0% from November 2022.
- New home median sales price: $505,050, down 4.7% from November 2022.
Analysis and Insights: Despite a dip in overall transactions and new home sales, the market maintains stability. The decline in the median price of new homes is partly attributed to a decrease in the average size of new constructions. The re-sale market, on the other hand, exhibits resilience, with prices holding up well.
Conclusion: As we navigate the real estate landscape in Maricopa County, these insights into November’s market trends provide a valuable perspective. Stay tuned for more updates, and remember, knowledge is your greatest asset in the dynamic world of real estate. I’m here to help!
CROMFORD MARKET INDEX
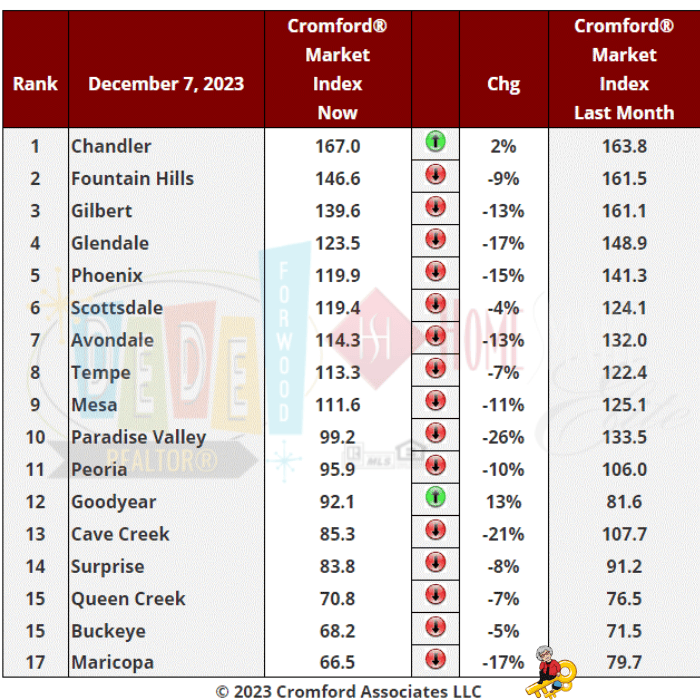
one of my favorite ways to track Valley trends. There was an average decline of 9.9% in the Cromford® Market Index for the 17 cities above. This is an improvement over the 13.1% decline we saw last week, but it is still a negative move. We a watching to see which cities start to move in a positive direction. So far we have Goodyear which has raised its CMI an impressive 13% and is now back in the balanced zone after spending 55 days as a buyer’s market. Chandler has also shown an improvement over the last month, but this is a less impressive 2%. However it gets credit for staying at the top of the table and its lead over Fountain Hills has opened up significantly.
The remaining 15 cities have all moved down, with Paradise Valley collapsing by 26% and now below 100. Cave Creek, Glendale and Maricopa are also heavily down and the all-important Phoenix is down 15%. Demand is clearly picking up, but not as energetically as you might expect after almost 100 basis points have been lopped off the 30-year fixed mortgage rate. We hear that purchase applications for mortgages jumped 35% last week, but this is from an extremely low level.
A few cities have seen their CMI move higher in the last week: Surprise, Buckeye, Avondale, Queen Creek, Mesa and Scottsdale. However, some of this is due to the usual seasonal weakening of supply and cannot be fully credited to stronger demand.
9 out of 17 cities are still seller’s markets with Paradise Valley, Goodyear and Peoria in the balanced zone while Cave Creek, Surprise, Buckeye, Queen Creek and Maricopa are all buyer’s markets. Maricopa and Buckeye have dropped below 70, so buyers have a strong advantage in these locations.
So in summary. we are seeing gradual improvement in the demand trend, and supply is no longer increasing in most areas.
Concise Market Snapshot
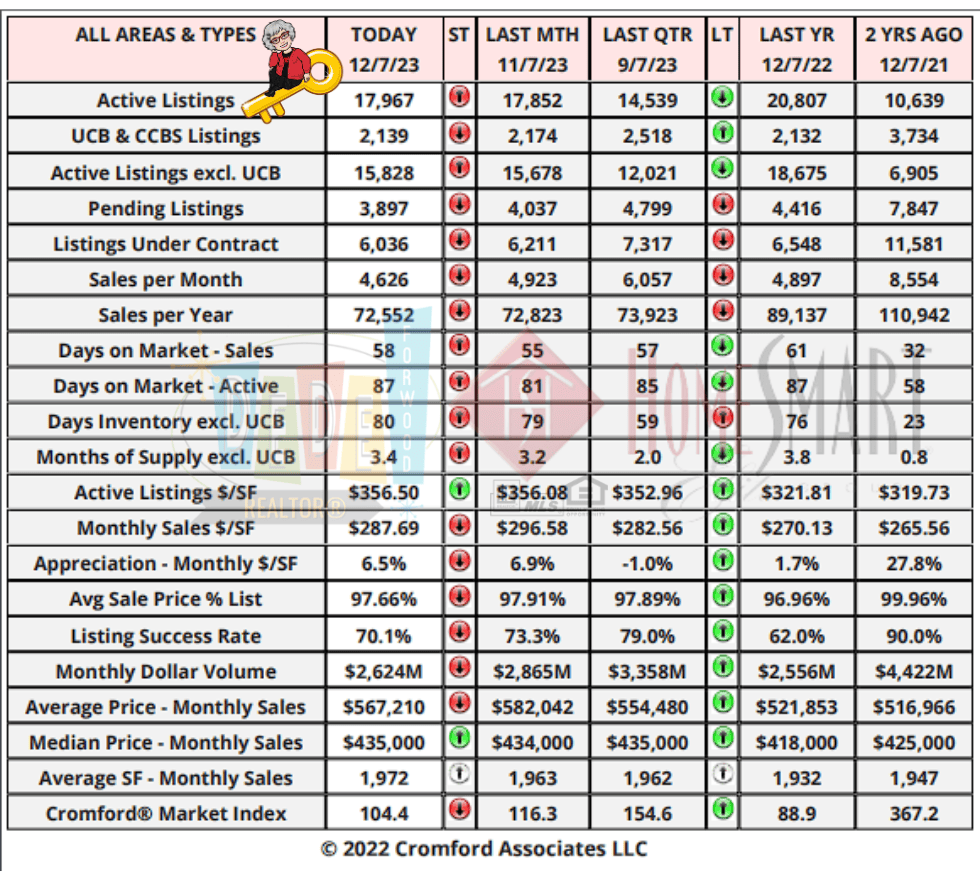
This table provides a concise statistical summary of today’s residential resale market in the Phoenix metropolitan area.
The figures shown are for the entire Arizona Regional area as defined by ARMLS. All residential resale transactions recorded by ARMLS are included. Geographically, this includes Maricopa county, the majority of Pinal county and a small part of Yavapai county. In addition, “out of area” listings recorded in ARMLS are included, although these constitute a very small percentage (typically less than 1%) of total sales and have very little effect on the statistics.
All dwelling types are included. For-sale-by-owner, auctions and other non-MLS transactions are not included. Land, commercial units, and multiple dwelling units are also excluded.
BankRate Mortgage Rates:
On Friday, December 08, 2023, the current average interest rate for the benchmark 30-year fixed mortgage is 7.41%, falling 16 basis points over the last week. If you’re looking to refinance, the national average interest rate for a 30-year fixed refinance is 7.52%, decreasing 17 basis points from a week ago. In addition, today’s national 15-year fixed refinance interest rate is 6.69%, decreasing 18 basis points over the last seven days.
New Listings:
New to the Market
 MLS IDX Listing Disclosure © 2025
Copyright 2024 Arizona Regional Multiple Listing Service, Inc. All rights reserved. Information Not Guaranteed and Must Be Confirmed by End User. Site contains live data.
Upcoming Open Houses:
Don’t forget to bring me!
Open Houses this Weekend
 MLS IDX Listing Disclosure © 2025
Copyright 2024 Arizona Regional Multiple Listing Service, Inc. All rights reserved. Information Not Guaranteed and Must Be Confirmed by End User. Site contains live data.
Recent Price Changes:
Recent Price Changes
 MLS IDX Listing Disclosure © 2025
Copyright 2024 Arizona Regional Multiple Listing Service, Inc. All rights reserved. Information Not Guaranteed and Must Be Confirmed by End User. Site contains live data.
Featured Listings:
Featured Listings
 MLS IDX Listing Disclosure © 2025
Copyright 2024 Arizona Regional Multiple Listing Service, Inc. All rights reserved. Information Not Guaranteed and Must Be Confirmed by End User. Site contains live data.
New Build Homes:
Thinking about a new build home? Some might not be ready for a year, but some are close to finished. Homebuilders offer great interest rates (if you use their lender…), and are a viable option for many of my people. But, don’t forget you need representation for YOU…so bring me before you visit a community or Models. The nice person works for the Builder, as does the Lender and the Title Company. Make sure you have someone looking out for YOUR interest and TAKE ME WITH YOU! Just want to shop? I have a great website with all the Valley Builders, shop for features and areas you want WITHOUT being stalked by each and every builder you’re perusing. We’ll visit when YOU’RE ready. Browse safely and securely here.
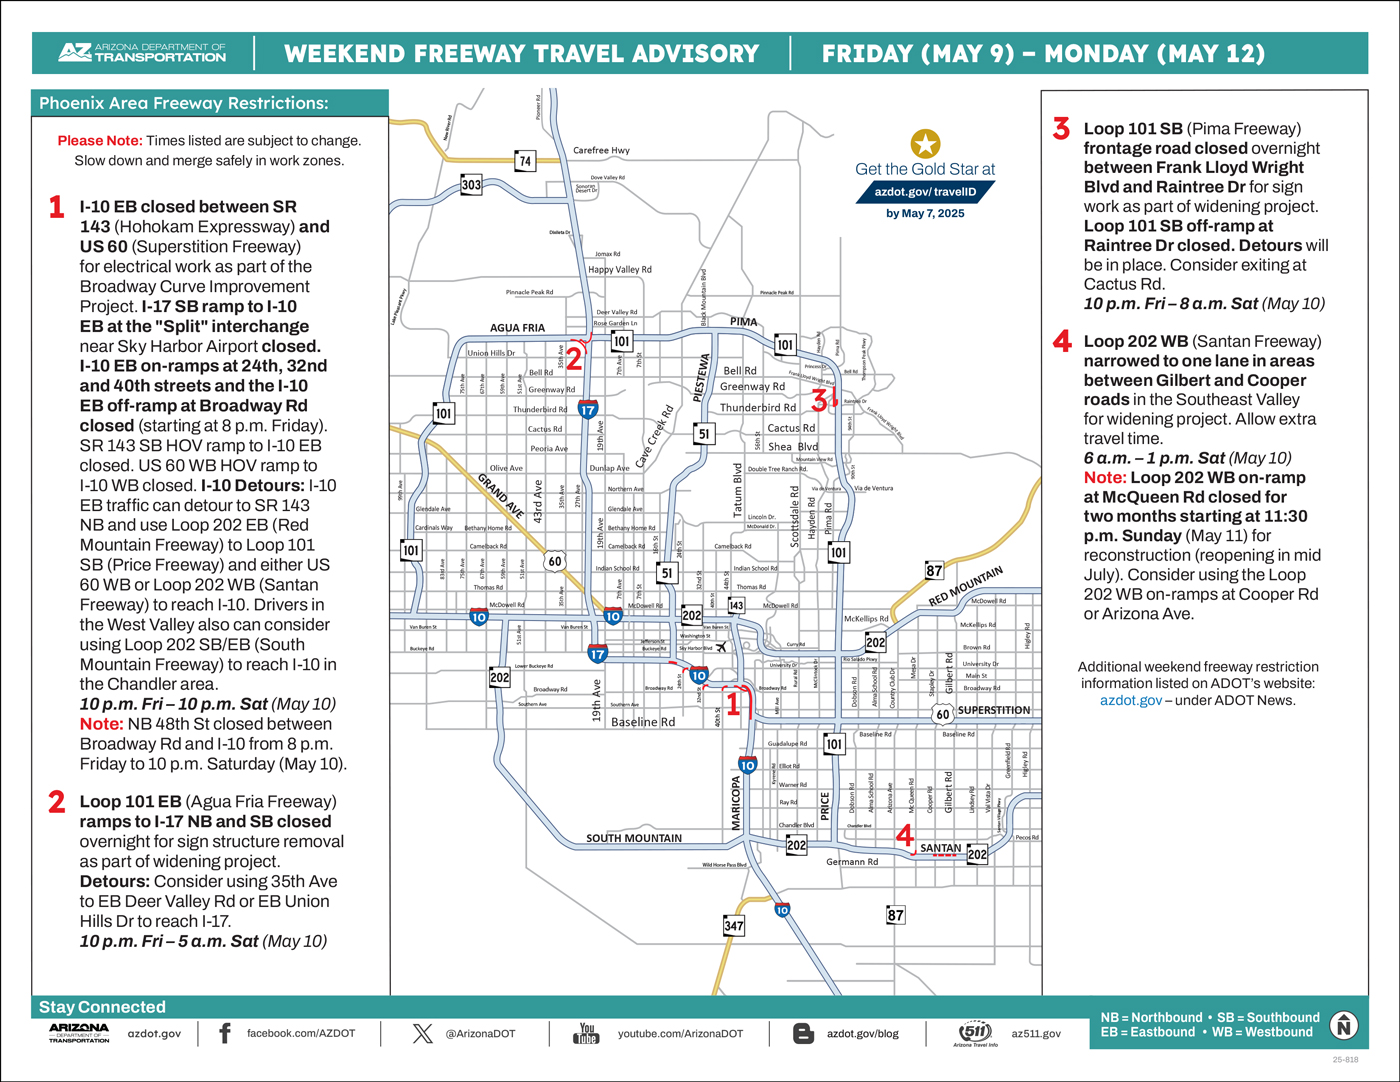
ADOT: No major weekend freeway closures in Phoenix area (Dec. 8-11). Drivers should use caution with work still possible near freeways.
No major closures for ongoing improvement projects are scheduled along Phoenix-area freeways this weekend (Dec. 8-11), according to the Arizona Department of Transportation.
To limit impacts on traffic, shopping and the delivery of products during the holiday travel season, ADOT and its contractors schedule work to avoid full freeway closures through New Year’s weekend.
With work still planned near freeways, including during overnight hours, drivers should remain alert, use caution and be prepared to slow down when approaching and traveling through any existing work zones.
Work zones remain in place for the I-10 Broadway Curve Improvement Project in the Phoenix area. The westbound US 60 HOV lane ramp to westbound I-10 will be closed overnight from 9 p.m. Friday to 7 a.m. Saturday (Dec. 9) for freeway lighting work. Drivers can instead use the primary ramp connecting the two freeways.
Drivers also should use caution and obey reduced speed limits within the I-17 widening project currently underway between Anthem and Sunset Point.
ADOT plans and constructs new freeways, additional lanes and other improvements in the Phoenix area as part of the Regional Transportation Plan for the Maricopa County region. Most projects are funded in part by Proposition 400, a dedicated sales tax approved by Maricopa County voters in 2004.
Real-time highway conditions are available on ADOT’s Arizona Traveler Information site at az511.gov and by calling 511. Information about highway conditions also is available through ADOT’s Twitter feed, @ArizonaDOT.
Valley of the Sun Sold Listings
- 7050,7601,6318,6209,5732,5486,5835,5158,5584,4733,5818,6921
Information is deemed to be reliable, but is not guaranteed. © 2025
Valley of the Sun Inventory
- 19844,20238,20565,20333,20279,21354,23127,24226,23003,23546,25738,28297
- 9621,9474,8192,7689,8817,9001,9409,7451,6073,11120,10468,11025
Information is deemed to be reliable, but is not guaranteed. © 2025
Valley of the Sun New Listings
- 9621,9474,8192,7689,8817,9001,9409,7451,6073,11120,10468,11025
Information is deemed to be reliable, but is not guaranteed. © 2025
Valley of the Sun Pending Listings
- 7188,6637,5977,5646,5600,5650,5604,5048,4532,6284,6431,4920
Information is deemed to be reliable, but is not guaranteed. © 2025
Valley of the Sun Absorption Rate
- 3.32,3.37,3.45,3.46,3.44,3.65,3.96,4.11,3.87,3.93,4.28,4.7
Information is deemed to be reliable, but is not guaranteed. © 2025
Valley of the Sun Sale to Original List Price Ratio
- 96.1,96.2,96.1,96.0,95.6,95.8,96.0,95.8,95.3,95.4,95.8,95.8
Information is deemed to be reliable, but is not guaranteed. © 2025
Valley of the Sun Average Days on Market
- 66.0,64.7,65.2,66.8,71.1,70.3,71.9,71.1,75.7,81.5,80.0,75.7
Information is deemed to be reliable, but is not guaranteed. © 2025
Valley of the Sun New Listings Volume
- 6338420435,6071658198,4983401100,4530732999,5507397584,6185778144,6417133762,5000087196,4004342725,8378979340,7257015624,7646085297
Information is deemed to be reliable, but is not guaranteed. © 2025
What’s Up with Real Estate? National news and local views
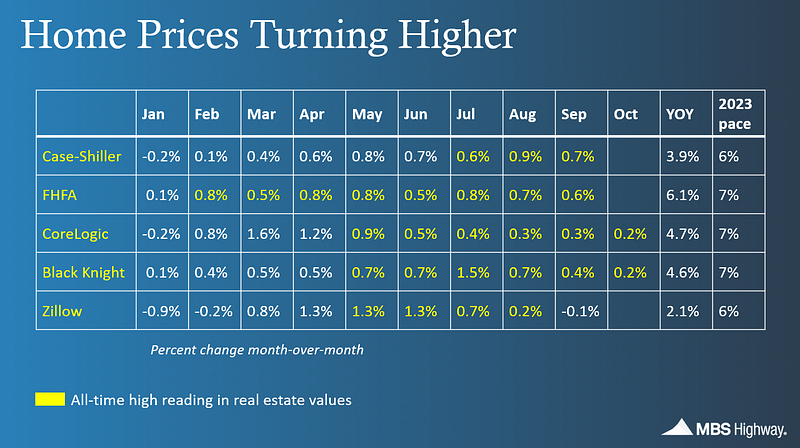
Slower, but still rising. Even with average 30-yr mortgage rates briefly exceeding 8% in October, home prices continued to rise. The housing data providers Black Knight and Core Logic both saw home prices 0.2% MoM during the month. That means that year-to-date, prices have risen 6%.
Job market loosens up a bit
On Tuesday, the JOLTS report (Job Openings and Labor Turnover Survey) shocked the market [electricity pun], with job openings dropping to 8.73 million in October, from 9.35 million in September. While that’s still a rather large number, you need to keep a few things in mind:
- It was well below consensus expectations of 9.40 million
- It was the lowest job openings figure since March 2021
- It was 27% below the peak for job openings: 12.03 million in March 2022
- The pre-pandemic figure was 7.18 million in January 2020
And then on Wednesday, we got ADP’s private employment report, which showed a continued slowdown in both job growth and wage growth.
- Companies added 103,000 jobs in November. That means that the three month moving average of job additions was 99,000/month, the lowest figure since March 2021
- While total job growth was still positive, several important sectors shed jobs during the month: Leisure & Hospitality, Manufacturing, Professional & Business Services, and Construction. Recall that Leisure & Hospitality has been one of strongest drivers of job growth in the last 18 months.
- Wage growth eased to +5.6% YoY (for people who stuck around) and +8.3% YoY (for people who got a new job). A year ago those figures were +7.6% YoY and +15.7%. So wages are still growing, they’re just growing a lot slower.
The all-important BLS jobs figure for the month of November will be out on Friday (today). The JOLTs and ADP data suggests that we’ll get a ‘good’ number (one that encourages the Fed to stay on hold) from the BLS. But that’s no guarantee. While the ADP and BLS jobs figures generally move in the same direction, from month to month they can — and do — go the opposite way.

Reminder: Nobody wants people to lose their jobs. But the Fed is looking at both inflation AND employment levels. Without clear signs that the historically tight labor market is loosening up, the Fed will be concerned that inflation could come roaring back. As callous as it sounds, we need to see the unemployment rate rising to convince the Fed that rate cuts (rather than more rate hikes) are the next course of action.
The final FOMC (Federal Open Markets Committee) meeting of 2023 will be held on December 12–13, with the policy rate decision on Wednesday, December 13. It’s only a slight exaggeration to say that nobody expects a rate hike (or a rate cut). That was the case before we got the JOLTs and ADP data, so it would take a monumentally horrific BLS jobs number today to convince Fed members that further tightening is needed.
A Closer Look at Inventory Levels
How was it possible that average 30-yr mortgage rates leapt from 3% to 8% over the last two years and home prices (for the most part) kept rising? Declining and low inventory levels; demand much greater than supply.
That’s why we need to watch inventory levels closely. A significant rise in inventory at the national or metro level would put pressure on prices — unless demand rises to meet it. Obviously, if mortgage rates keep falling, affordability (and demand) will expand. The big unknown is how sellers will react to these lower rates. Will they still feel ‘locked in?’
Here are some observations from Realtor.com’s latest update to its residential listings database:
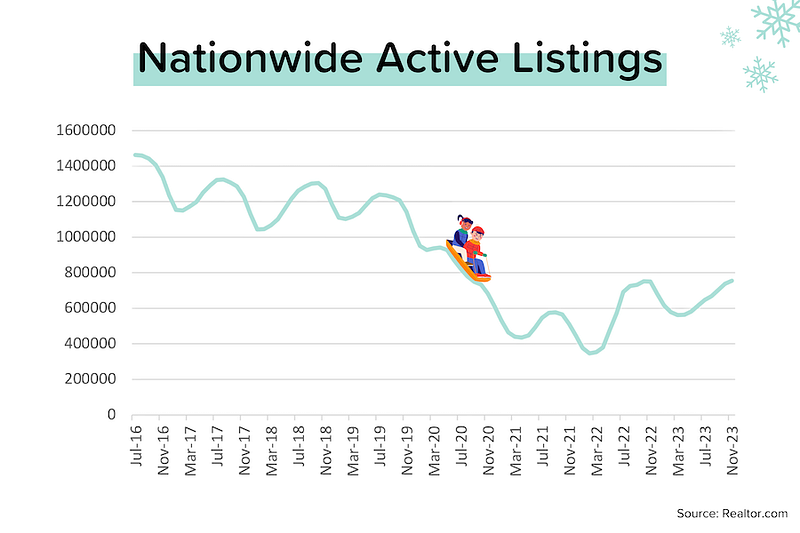
- Active listings in November rose 2.4% MoM to 755,000. Normally, inventory would be falling by this time of year, but that hasn’t happened yet. Verrrry eeenteresssting.
- 755,000 is more than double the March 2022 lows, but it’s still 34% below pre-pandemic levels (November 2019).
- For the first time in 18 months, new listings in November 2023 were HIGHER than the same month last year.
- For the top 100 metros, 69 saw month-on-month increases in inventory. The largest % increase was North Portland/Sarasota (+13.5% MoM), but Oklahoma City, Birmingham, Tucson, Miami, Tampa and Cape Coral all saw more than 10% MoM increases.
- For the top 100 metros, 45 saw year-over-year increases in inventory. The largest % increase was in Cape Coral (+101% YoY). Other cities with large YoY increases in inventory were North Portland/Sarasota (+63%), El Paso (+32%), New Orleans (+25%), Memphis (+25%), Baton Rouge (+21%) and San Antonio (+20%).
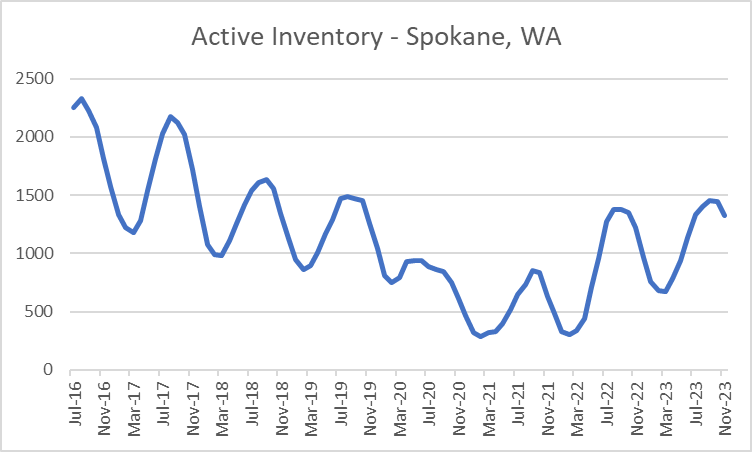
- For comparison, I’ve included the inventory chart for Spokane, WA, where active inventory today is about the same as it was pre-pandemic. That’s how different the inventory picture can look from city to city!
- I’d be happy to send you inventory charts for your market area if you’re interested. Just email me: scott@listreports.com.
Mortgage Market
If we get a ‘good’ BLS jobs number this morning (Friday), I’d be very surprised if average 30-yr mortgage rates don’t move into the 6% range by Monday. Already, rates have fallen by about 1 percentage point in less than 2 months. That’s a big move!
In a nutshell, nobody expects the Fed to hike rates next week. In fact, the market is now pricing in somewhere between one and six rate CUTS over the course of 2024. Is the bond market getting ahead of itself? Probably. Ultimately, it will depend on how the economy behaves.

They Said It
“Restaurants and hotels were the biggest job creators during the post pandemic recovery. But that boost is behind us, and the return to trend in leisure and hospitality suggests that the economy as a whole will see more moderate hiring and wage growth in 2024.” — Nela Richardson, ADP Chief Economist
“Home price growth maintained its upward momentum in October, which continues to reflect gains from the strong spring season and contrasts with last year’s home price declines. But even with high mortgage rates, October’s price gains line up with historical trends and speak to the strength of some potential buyers’ purchasing power, as they continue to outnumber available homes for sale. Metros that are seeing relatively stronger price gains are those with higher job growth, as well as those with an influx of higher-income, in-migrating households.” — Dr. Selma Hepp, CoreLogic Chief Economist
FHFA Unveils New Conforming Loan Limits for 2024: What Homebuyers in Arizona Need to Know:
Exciting news is on the horizon for prospective homebuyers in Arizona! The Federal Housing Finance Agency (FHFA) has just announced the conforming loan limit values for 2024, and there’s a lot to unpack. If you’re considering stepping into the real estate market or planning to upgrade your Arizona home, these updates might impact your decision-making. Let’s delve into the details and explore what this means for the housing landscape in the Grand Canyon State.
Baseline Conforming Loan Limit Increase: Starting with the basics, the FHFA has increased the baseline conforming loan limit (CLL) for one-unit properties to $766,550 in 2024. This marks a notable uptick of $40,350 from the previous year. But why the increase? According to the Housing and Economic Recovery Act (HERA), the FHFA adjusts CLL values annually to reflect changes in the average U.S. home price. The recently published FHFA House Price Index® (FHFA HPI) for the third quarter of 2023 indicates a 5.56% increase in average home values over the last four quarters.
High-Cost Areas and Special Provisions: For those eyeing properties in high-cost areas where 115% of the local median home value surpasses the baseline CLL, good news awaits. The applicable loan limit will be higher, with the ceiling set at 150% of the baseline limit. In these high-demand locales, the new ceiling loan limit for one-unit properties will reach $1,149,825. Special statutory provisions apply to Alaska, Hawaii, Guam, and the U.S. Virgin Islands, where the baseline loan limits for one-unit properties will also be $1,149,825.
Arizona’s Impact: Due to the surge in home values, CLL values are set to rise in nearly every U.S. county. How does this translate to Arizona? The increased loan limits are poised to open up opportunities for more buyers, making it an opportune time to explore the Arizona real estate market.
Resources for Homebuyers: To provide a comprehensive understanding of the 2024 CLL values, FHFA offers additional resources, including:
- List of 2024 conforming loan limits for all U.S. counties.
- A map showcasing the 2024 conforming loan limits nationwide.
- Detailed addendum outlining the methodology used for CLL determinations.
- FAQs covering broader topics related to CLL values.
Got questions? FHFA welcomes inquiries about the 2024 CLL values at LoanLimitQuestions@fhfa.gov.
Conclusion: As Arizona continues to thrive in the real estate arena, these updates from FHFA present exciting possibilities for homebuyers. Whether you’re a first-time buyer or a seasoned homeowner, staying informed about CLL values is key to making informed decisions in the ever-evolving housing market. For more details, speak to a local lender (my favorites are Michael and Brogan) to see if this is of benefit to you!
Here’s your links for this weekend’s events!
My Website always has a list of what’s upcoming. Go here and maybe I’ll see you out there!
|
Get your Home Value, wealth Snapshot and Ideas what to do with your Equity Every Month!
Join DeDe’s Secret Private Facebook group for tips, tricks, discounts and Freebies!
See you next Week!
DeDe


