
Hello, Hope your Late September is going well! Here’s the news, listings, open houses, events and more! Reach out if you have any specific questions! Enjoy!
Phoenix-Area Real Estate News
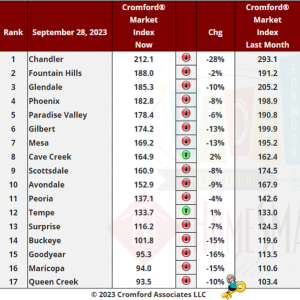
We still have 2 cities that moved in a direction favorable to sellers over the last month, Cave Creek and Tempe. However these 2 are only just positive and their change over the last 2 weeks is unfavorable for sellers. In any case ,these are two of the smallest of the 17 and the general direction of the market is swinging towards buyers. Supply is increasing and demand remains extremely weak.
We can also see that the market is becoming more favorable to buyers at an accelerating rate. The average CMI change in these 17 cities over the last month was -9.4%, more negative than last week when we measured -7.8%.
Most negative again this week is Chandler, down 28%, though it remains in first place. Goodyear, Maricopa, Buckeye, Mesa and Gilbert are also much weaker than this time last month, down at least 13%.
13 out of 17 cities are still sellers markets with Buckeye, Goodyear, Queen Creek and Maricopa in the balanced zone. However 3 of these cities are now below the 100 mark implying that buyers have a slight edge in negotiations in Goodyear, Maricopa and Queen Creek. On the current trajectory, these 3 could be buyers’ markets by mid October, with Buckeye not far behind.
Supply remains well below normal in most areas, but Maricopa’s supply index is now over 100, joining Casa Grande. Litchfield Park looks next to breach the 100 mark for its supply. Supply is still extremely low in Anthem, Chandler, El Mirage and Gilbert.
———————————————————————————————————————————————————————————————————————————
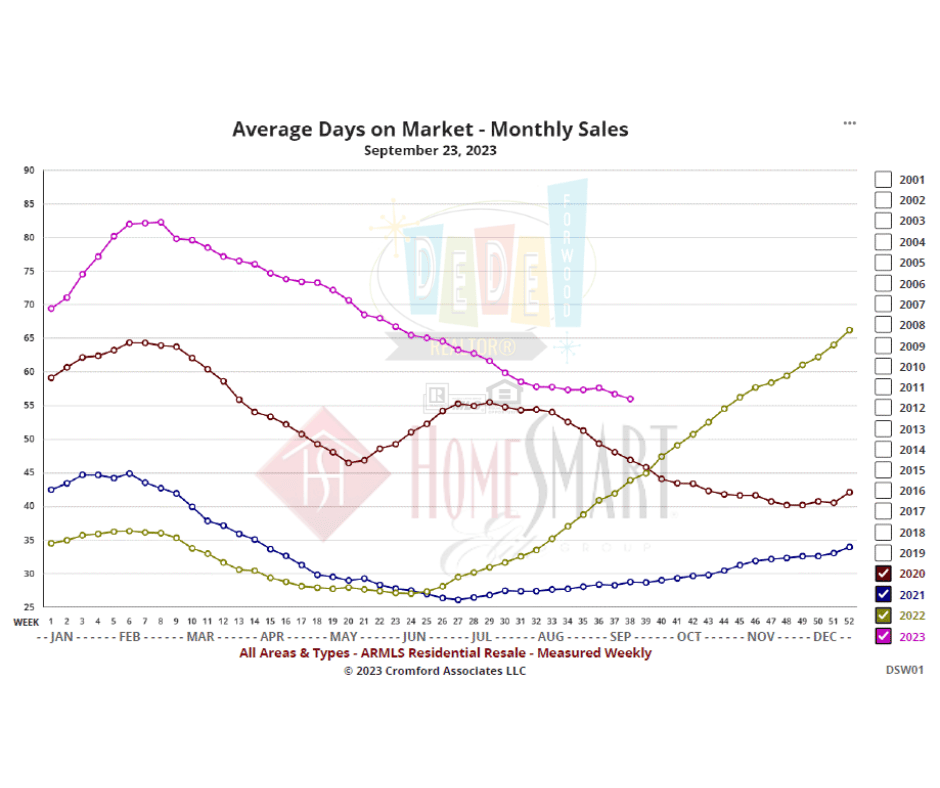
Average Days on Market – Monthly Sales
If you were basing your view on this chart, you would take away the impression that the market is improving for sellers and has been since February. This is not true. The market stopped improving back in June and is getting increasingly difficult as inventory starts to build and demand withers in the face of affordability pressures. Yet the average days on market for closed listings continues to fall.
Over the last 20 years, the average days on market can be seen to respond to market changes, but is is usually 2 to 4 months behind the times. This makes it worse than useless. It is positively misleading. We include the chart because so many people are familiar with the measure and want to know what it is. But we attach no credibility to any signals that it might send out. All the signals are out of date by the time they are received.
Concise Market Snapshot
Valley of the Sun Sold Listings
- 7050,7601,6318,6209,5731,5487,5833,5158,5583,4731,5817,6954
Information is deemed to be reliable, but is not guaranteed. © 2025
Valley of the Sun Inventory
- 19843,20237,20564,20332,20280,21356,23131,24233,23020,23573,25737,27535
- 9621,9474,8192,7689,8817,9001,9409,7451,6073,11120,10466,11294
Information is deemed to be reliable, but is not guaranteed. © 2025
Valley of the Sun New Listings
- 9621,9474,8192,7689,8817,9001,9409,7451,6073,11120,10466,11294
Information is deemed to be reliable, but is not guaranteed. © 2025
Valley of the Sun Pending Listings
- 7188,6637,5977,5646,5598,5649,5604,5050,4530,6303,6642,6494
Information is deemed to be reliable, but is not guaranteed. © 2025
Valley of the Sun Absorption Rate
- 3.32,3.37,3.45,3.46,3.44,3.65,3.96,4.11,3.88,3.93,4.28,4.57
Information is deemed to be reliable, but is not guaranteed. © 2025
Valley of the Sun Sale to Original List Price Ratio
- 96.1,96.2,96.1,96.0,95.6,95.8,96.0,95.8,95.3,95.4,95.8,95.8
Information is deemed to be reliable, but is not guaranteed. © 2025
Valley of the Sun Average Days on Market
- 66.0,64.7,65.2,66.8,71.1,70.3,71.9,71.1,75.7,81.5,80.0,77.7
Information is deemed to be reliable, but is not guaranteed. © 2025
Valley of the Sun New Listings Volume
- 6336656755,6070361412,4981802722,4528549389,5505279350,6181215417,6408533461,4990243000,3989362142,8348153311,7211801306,7764958223
Information is deemed to be reliable, but is not guaranteed. © 2025
BankRate Mortgage Rates:
For today, Friday, September 29, 2023, the current average interest rate for the benchmark 30-year fixed mortgage is 7.77%, increasing 2 basis points over the last seven days. If you’re looking to refinance your current loan, today’s average interest rate for a 30-year fixed refinance is 7.97%, rising 11 basis points over the last week. In addition, today’s average 15-year refinance interest rate is 7.04%, up 6 basis points compared to this time last week.
New Listings:
New to the Market


 MLS IDX Listing Disclosure © 2025
Copyright 2024 Arizona Regional Multiple Listing Service, Inc. All rights reserved. Information Not Guaranteed and Must Be Confirmed by End User. Site contains live data.
Upcoming Open Houses:
Open Houses this Weekend


MLS IDX Listing Disclosure © 2025
Copyright 2024 Arizona Regional Multiple Listing Service, Inc. All rights reserved. Information Not Guaranteed and Must Be Confirmed by End User. Site contains live data.
ADOT’s Weekend Freeway Travel Advisory- Phoenix Area:
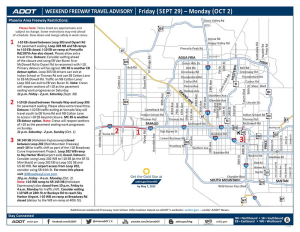
ADOT’s Weekend Freeway Travel Advisory (Sept. 29-Oct. 2) – Phoenix Area –Plan on closures along eastbound I-10 in the Goodyear-Buckeye area
PHOENIX – Improvement projects will require closures or lane restrictions on a few sections of Phoenix-area freeways this weekend (Sept. 29-Oct. 2), according to the Arizona Department of Transportation. Drivers should allow extra travel time and plan detour routes if necessary while the following weekend restrictions are in place:
- Eastbound Interstate 10 closed between Loop 303 and Dysart Road in the West Valley from 11 p.m. Friday to 2 p.m. Saturday (Sept. 30) for pavement sealing. North- and southbound Loop 303 ramps to eastbound I-10 closed. Eastbound I-10 on-ramp at Perryville Road/187th Avenue also closed. Please allow extra travel time.
- Detours: Consider exiting ahead of the closure and using eastbound Van Buren Street or McDowell Road to Dysart Road to reconnect with I-10. Primary detours will be signed. Eastbound MC 85 is another detour option. Southbound Loop 303 drivers can exit at Indian School or Thomas roads and use southbound Cotton Lane to eastbound McDowell Road. Traffic on northbound Cotton Lane/Loop 303 can exit to eastbound Van Buren Street (to travel beyond closure).
- Note: Crews will reopen sections of I-10 as the pavement sealing work progresses on Saturday.
- Eastbound I-10 closed between Verrado Way and Loop 303 from 11 p.m. Saturday to 2 p.m. Sunday (Oct. 1) for pavement sealing. Please allow extra travel time.
- Detours: Eastbound I-10 traffic exiting at Verrado Way will travel south to eastbound Yuma Road and can use northbound Cotton Lane to access eastbound I-10 beyond closure. Eastbound MC 85 is another detour option.
- Note: Crews will reopen sections of I-10 as the pavement sealing work progresses on Sunday.
- Southbound State Route 143 (Hohokam Expressway) closed between Loop 202 (Red Mountain Freeway) and I-10 from 10 p.m. Friday to 4 a.m. Monday (Oct. 2) for traffic shift as part of the I-10 Broadway Curve Improvement Project. Westbound Loop 202 ramp to Sky Harbor Boulevard (airport exit) closed.
- Detours: Consider using westbound Loop 202 to eastbound I-10 (at the SR 51 Mini-Stack) or eastbound Loop 202 to southbound Loop 101 and westbound US 60. For airport access from Loop 202, consider using southbound 44th Street. For more info please visit I10BroadwayCurve.com.
- Westbound I-10 ramp to northbound SR 143 (Hohokam Expressway) closed from 10 p.m. Friday to 4 a.m. Monday (Oct. 2) for traffic shift. Sky Harbor Airport traffic can exit westbound I-10 at 24th Street or Buckeye Road. Westbound I-10 on-ramp at Broadway Road closed. Detour to the westbound I-10 on-ramp at 40th Street.
Schedules are subject to change due to inclement weather or other factors. ADOT plans and constructs new freeways, additional lanes and other improvements in the Phoenix area as part of the Regional Transportation Plan for the Maricopa County region. Most projects are funded in part by Proposition 400, a dedicated sales tax approved by Maricopa County voters in 2004.
Real-time highway conditions are available on ADOT’s Arizona Traveler Information site at az511.gov and by calling 511. Information about highway conditions also is available through ADOT’s Twitter feed, @ArizonaDOT.
National Real Estate News
Real Estate News in Brief
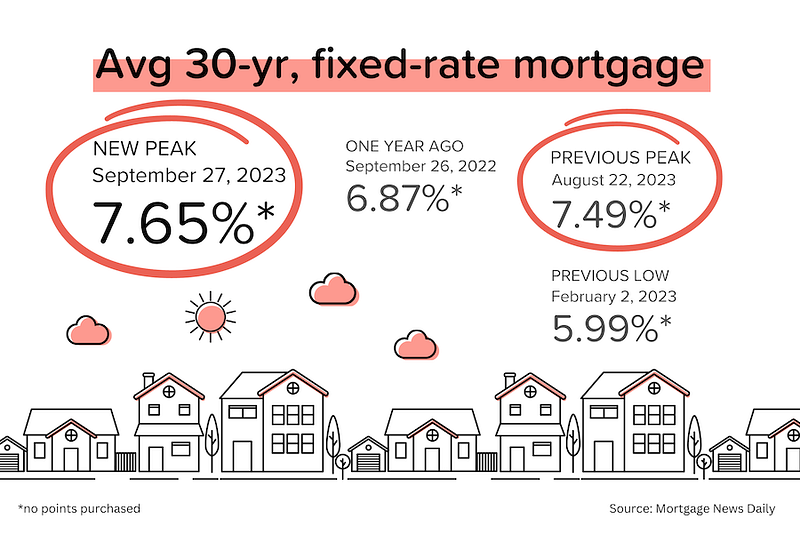
For would-be homebuyers, last week was a 1–2 punch of record home prices (Case-Shiller index) and a 23-year high for mortgage rates (average 7.65% on a 30-yr mortgage). In this environment, your clients know the cost of acting, but do they fully understand the cost of waiting?
Average 30-yr mortgage rates just set another new, two-decade high: 7.65%. Yields have been rising across the globe in response to ‘higher for longer’ commentary from central bankers. In addition, the Brent crude oil price is approaching $100/barrel, causing concerns about a rebound in inflation. [Mortgage News Daily]
August new home sales fell 8.7% MoM to an annualized pace of 675,000 units. That’s the lowest figure we’ve seen since March 2023. Even with the rate buydowns and other incentives that builders are offering, spiking mortgage rates are clearly dampening demand. [Census Bureau]
The pending home sales index for August dropped 7.1% MoM to 71.8. That was much worse than expectations, and suggests that existing home sales for September will come out between 3.7–3.9 million units. [NAR]
Ok, how about some good news (for homeowners anyway)? The Case-Shiller national home price index for July rose 0.6% MoM and hit a new all-time high. The modest decrease in prices that we saw in 2H 2022 has already been erased. 10 out of 20 big city indexes are also at new highs, and some of the hardest-hit west coast cities are seeing prices rebound quickly. [S&P Global]
A similar story from the FHFA index, which rose 0.8% MoM in July (the 6th-straight increase). Price growth for full-year 2023 is now annualizing at 7%! Prices in the Mid-Atlantic and Midwest continue to rise rapidly. [FHFA]
The nationwide office vacancy rate just hit an all-time high of 13.3%. (And it’s much higher in cities like San Francisco). With new space still being delivered, workers still loving WFH, and refinancings looming, office landlords are under pressure. [NAR]
Pending sales presage 3.7–3.9 million in existing home sales
I had a feeling that August pending sales would be bad. But they turned out much worse, falling 7.1% MoM and 18.7% YoY to 71.8. Even during the extra frigid (for transactions) winter of 2022, the pending sales number didn’t get this low. In April 2020 (when the onset of COVID convulsed the real estate market), the pending sales figure was 70 — just a shade lower than this month!

Q: OK, I get it. Pending sales were bad, but what does 71.8 mean in the real world?
A: An index level of 100 is comparable to 2001 activity levels, when monthly existing home sales were running at 5.0–5.5 million units annualized. So we’re running about 28% BELOW 2001 activity levels. I’d estimate that existing home sales for September will end up somewhere between 3.7 and 3.9 million units. Not good.
* Here’s a little trick: take the pending sales index number and multiply it by 52,000–55,000. That’s a pretty solid estimate of what annualized existing home sales will be next month. If there is reason to expect a higher % of cancellations, use 52,000; in more normal conditions use 54,000 or 55,000. So 71.8 X 52,000 = 3,734,0000 in predicted monthly existing sales at the low end.
Acting vs. Waiting
I’ve been seeing more news stories about ‘renting being cheaper than buying’. And also several surveys showing that a large percentage of would-be buyers are just waiting for prices or mortgage rates to come down. I understand their pain: affordability has been crushed by record home prices and mortgage rates spiking to two-decade highs.
But here’s the problem with waiting to buy (continuing to rent) when home prices are rising:
- According to Case-Shiller, national home prices rose nearly 6% in 2022. And based on the price growth we’ve seen during the first 7 months of 2023, we’re on pace for another 5% appreciation this year.
- If you had bought a home for $400,000 at the beginning of 2022, that home would now be worth approximately $445,000 (6% + 5% = 11% increase).
- In other words, you would have created $45,000 in equity value in just two years. This is a really big number.
- Let’s say you had put 10% down ($40,000). Your return on equity would already be >100% because you borrowed most of the purchase price, but the upside is all yours!
- On the other hand, let’s say that at the beginning of 2022 you decided to wait. But frustrated with watching home prices keep rising, you finally bit the bullet and bought a similar home at the end of 2023.
- You’re now paying $445,000 for the home, and putting $44,500 down (10%). And you’ve missed all that equity upside. And your landlord probably raised the rent at some point.

Take a look at any long-term (40+ years) chart of home prices. They have a strong tendency to rise. Not every year, of course. But if you hold onto a property for 5–10 years, the probability that you lose money over that period is very low.
One more thing I want to point out. Most rent vs. buy analysis is very simple, comparing monthly mortgage payments to monthly rent. That’s too simple to be useful. Buying a home has significant entry and ongoing costs that renters won’t face. But homebuyers get appreciation (see example above), amortization (the principal payment they make monthly lifts their equity value), and tax benefits (mortgage interest tax deductibility, large capital gains tax exclusions).
On the Case (Shiller) Again
The Case-Shiller national home price index hit a new, all-time high in July 2023. That’s big news, because it means that the modest (3%) price decline experienced in 2H 2022 has already been eliminated. Here are some other observations from the data:
- The national price index has risen (month-over-month) for six straight months.
- 10 of the individual big city indices are also at all-time highs. Chicago and Cleveland are already 4% above their mid-2022 peaks. Tampa Bay, Los Angeles and Dallas are probably 1–2 months away from setting new records.
- San Francisco (-10%), Seattle (-9%), Las Vegas (-8%), and Phoenix (-7%), are still well below their mid-2022 peaks, but Seattle and Phoenix are rebounding quickly.
- The national price index is up 43% since December 2019 (pre-COVID). Miami and Tampa Bay are both up 67%; and Atlanta, Charlotte, Phoenix and San Diego are all up more than 50%.
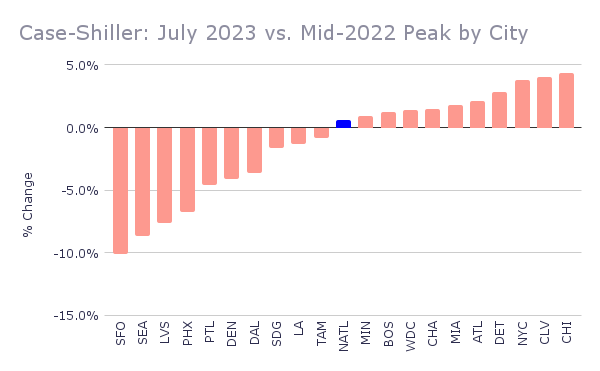
Reminder: The reason we pay so much attention to the Case-Shiller index is that it provides the most accurate measure of home price appreciation. By tracking large numbers of transaction pairs (e.g., House A sold in October 2017 at $300,000 and again in January 2024 at $550,000), the Case-Shiller index comes closest to measuring ‘true’ appreciation. Many of the other home price measures are skewed by the mix (high-end vs. low-end etc.) of properties being sold during the period.
Phoenix lies in 19th place, down from 17th last month and among the weakest cities on a year over year basis. More than half the cities are now showing positive price movement from one year ago and once again the northern cities are looking good on the year over year measure. The national average is +1.0% year over year.
Mortgage Market
Just one month after setting a new, two-decade high of 7.49% on August 22, average 30-year mortgage rates shot up to 7.65% on September 27. Since the Fed’s “2nd pause” on September 20, 30-year mortgage rates have risen more than 30 bps. Huh? The Fed DOESN’T hike rates, and mortgage rates still go up?
Yup. This is a painful reminder that the market, not the Fed, ultimately sets MBS and mortgage rates. And the market has been spooked by ‘higher for longer’ commentary from Powell, other Fed members and global central bankers. Earlier this week, Minneapolis Federal Reserve President Neel Kashkari said that he worried that interest rates may need to go “meaningfully higher” to fully quell inflation.
“The two sectors of the economy that are traditionally the most sensitive to interest rate hikes, autos and housing, have both added some signs of bottoming and in some cases are starting to show some recovery that makes me cautious that we might not be as restrictive as we otherwise would think.”
I’m not sure what ‘recovery’ he’s talking about. Existing home sales are running at 2008–2010 levels. And yes, home prices are rising, but that’s mainly because supply is so tight. And why is supply so tight? Because the Fed kept rates so low, for so long, that virtually everybody got or refinanced into a very low mortgage rate. No would-be homeseller wants to exchange a 3.25% 15-year mortgage for a 7.65% 30-year!
They Said It
“On a year-to-date basis, the National Composite has risen 5.3%, which is well above the median full calendar year increase in more than 35 years of data. Although the market’s gains could be truncated by increases in mortgage rates or by general economic weakness, the breadth and strength of this month’s report are consistent with an optimistic view of future results.” — Craig Lazarra, Managing Director at S&P DJI
“Mortgage rates have been rising above 7% since August, which has diminished the pool of home buyers. Some would-be home buyers are taking a pause and readjusting their expectations about the location and type of home to better fit their budgets. It’s clear that increased housing inventory and better interest rates are essential to revive the housing market” — Lawrence Yun, NAR’s Chief Economist
Here’s your links for this weekend’s events!

My Website always has a list of what’s upcoming. Go here and maybe I’ll see you out there!
Get your Home Value, wealth Snapshot and Ideas what to do with your Equity Every Month!

Join DeDe’s Secret Private Facebook group for tips, tricks, discounts and Freebies!

That’s all for this week! Know I am always here for any questions you have about Buying, Selling, or Investing in Residential Real Estate! HomeOwnership too! Vendors and Tradespeople too! Don’t hesitate to Reach out
See you next Week!
DeDe