
Here’s the news, listings, open houses, events and more! Reach out if you have any specific questions! Enjoy!
Phoenix-Area Real Estate News
🏡✨ Exciting news on the real estate front: Demand seems to be stretching its legs and making a comeback! 🚀📈 And you know what’s fueling this resurgence? The magic of lower mortgage rates! 🌟 Currently, we’re looking at a cool 7.45% for a typical 30-year fixed loan, and FHA is playing the game at 6.77%. Sure, they’re not the rock-bottom rates of our dreams, but hey, they’re a breath of fresh air compared to the 7.88% and 7.31% we were dealing with on October 31.
Now, let’s dive into some numbers – because who doesn’t love a good stat update? Today’s contract ratio for all areas and types is hanging out at 40.56, strutting its stuff from 37.46 on November 4. It’s still a bit shy of where it was a month ago, but guess what? The tide has turned! 🔄 It had been on a bit of a rollercoaster, sliding down from late May to early November, but now, it’s doing a heading in the opposite direction.
Quick note: As we inch closer to Thanksgiving, supply usually takes a bit of a snooze. 🦃💤 But here’s the exciting part – if demand can keep riding this wave, we’re throwing optimism around that our real estate market rollercoaster might just stabilize by the end of the year. 🎢📅 Of course, we’re crossing our fingers and knocking on wood because, you know, all bets are off if interest rates decide to move higher again. 🤞📈 Stay tuned for more updates on this real estate adventure!
Ranking 41 cities by their annual average $/SF
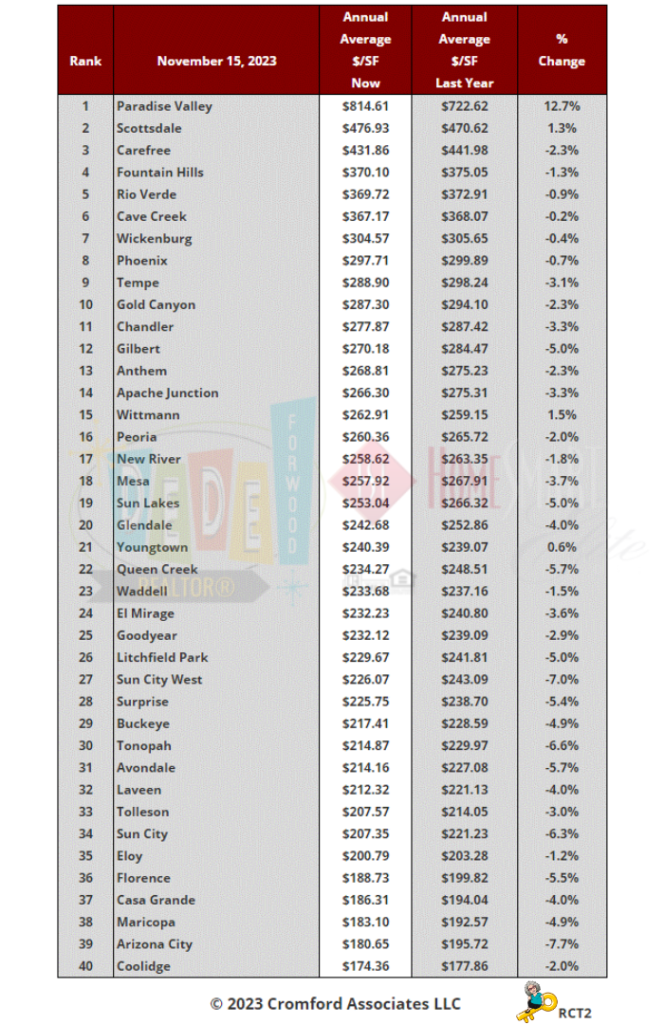
The latest monthly table ranking 41 cities by their annual average $/SF just published Wednesday!
Let’s dive into the highlights: Paradise Valley is stealing the show with an impressive 12.7% surge in prices over the past year, widening the gap even more with the rest of Greater Phoenix. 📈🌵 Scottsdale is also riding the wave, inching up by 1.3%. But get this – Paradise Valley is now a whopping 71% pricier than Scottsdale, up from a 54% premium last year. Talk about a leap!
Now, in the tiny town corner, Wittmann and Youngtown are the dynamic duo showing positive moves in the past 12 months. Keep in mind, their monthly average $/SF might not tell the whole story due to a small sample size for sales in a single month.
On the flip side, at the bottom of the list, we’ve got Arizona City, Sun City West, Sun City, Tonopah, Queen Creek, Avondale, Florence, and Surprise witnessing declines of over 5% in their average $/SF. 📉🌆 Our detective work leads us to the theory that the spike in mortgage rates has hit the lower-priced areas on the outskirts more than the upscale spots and those closer to the city center.
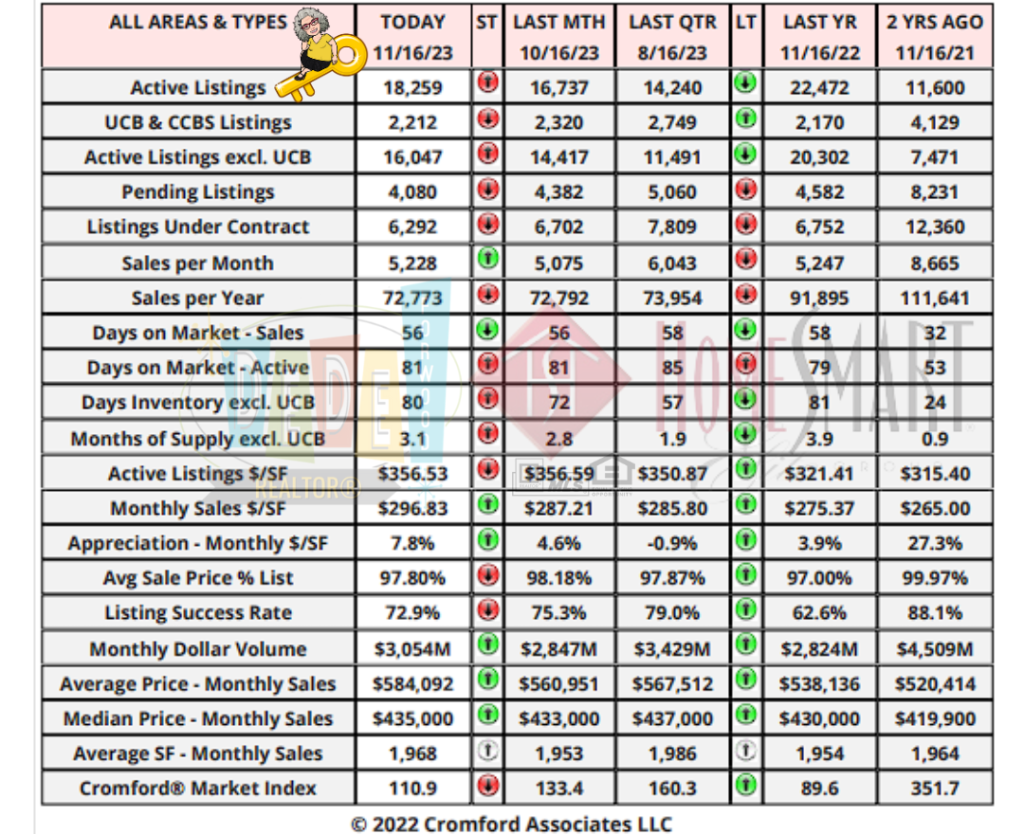
Concise Market Snapshot
This table provides a concise statistical summary of today’s residential resale market in the Phoenix metropolitan area.
The figures shown are for the entire Arizona Regional area as defined by ARMLS. All residential resale transactions recorded by ARMLS are included. Geographically, this includes Maricopa county, the majority of Pinal county and a small part of Yavapai county. In addition, “out of area” listings recorded in ARMLS are included, although these constitute a very small percentage (typically less than 1%) of total sales and have very little effect on the statistics.
All dwelling types are included. For-sale-by-owner, auctions and other non-MLS transactions are not included. Land, commercial units, and multiple dwelling units are also excluded.
BankRate Mortgage Rates:
On Friday, November 17, 2023, the current average 30-year fixed mortgage interest rate is 7.69%, down 18 basis points from a week ago. If you’re looking to refinance your current mortgage, today’s average 30-year fixed refinance interest rate is 7.78%, down 22 basis points compared to this time last week. In addition, today’s average 15-year fixed refinance interest rate is 7.00%, falling 18 basis points from a week ago.
New Listings:
New to the Market


 MLS IDX Listing Disclosure © 2025
Copyright 2024 Arizona Regional Multiple Listing Service, Inc. All rights reserved. Information Not Guaranteed and Must Be Confirmed by End User. Site contains live data.
Upcoming Open Houses:
Don’t forget to bring me!
Open Houses this Weekend


MLS IDX Listing Disclosure © 2025
Copyright 2024 Arizona Regional Multiple Listing Service, Inc. All rights reserved. Information Not Guaranteed and Must Be Confirmed by End User. Site contains live data.
Recent Price Changes:
Recent Price Changes


MLS IDX Listing Disclosure © 2025
Copyright 2024 Arizona Regional Multiple Listing Service, Inc. All rights reserved. Information Not Guaranteed and Must Be Confirmed by End User. Site contains live data.
Featured Listings:
Featured Listings


MLS IDX Listing Disclosure © 2025
Copyright 2024 Arizona Regional Multiple Listing Service, Inc. All rights reserved. Information Not Guaranteed and Must Be Confirmed by End User. Site contains live data.
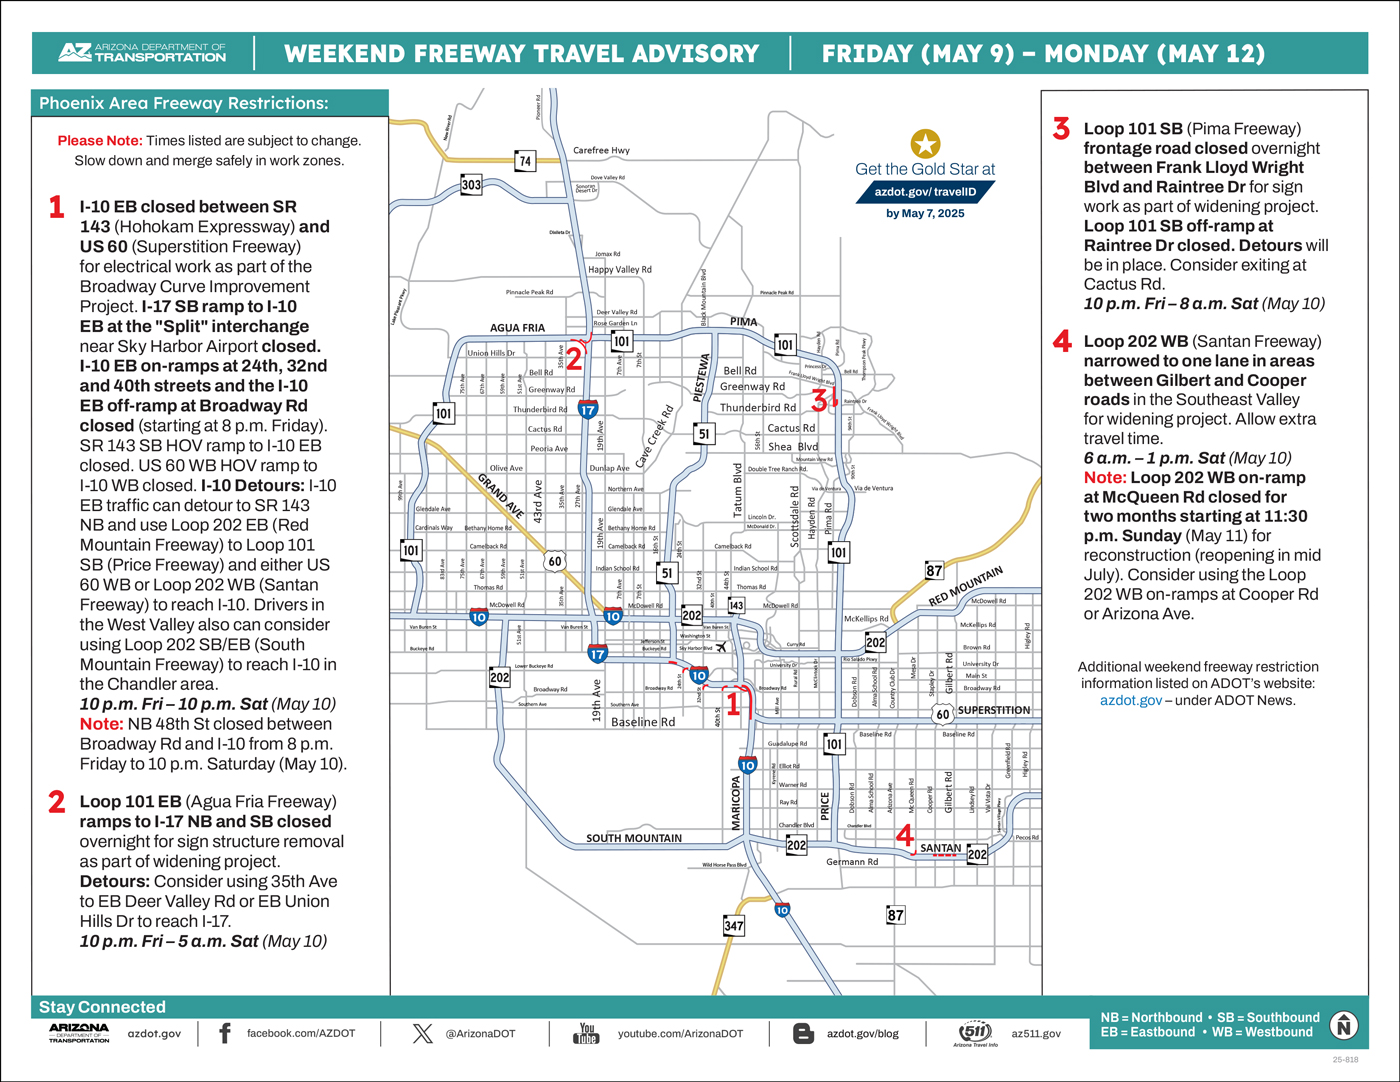
ADOT’s Weekend Freeway Travel Advisory (Nov. 17-20) – Phoenix Area
Plan for closures of sections of westbound I-10, southbound SR 143
PHOENIX – Stretches of westbound Interstate 10 and southbound State Route 143 (Hohokam Expressway) near Phoenix Sky Harbor International Airport will be closed this weekend (Nov. 17-20) for construction. Drivers should consider using alternate routes if necessary while the following weekend closures are in place:
- Westbound I-10 closed between US 60 (Superstition Freeway) and 40th Street from 10 p.m. Friday to 4 a.m. Monday (Nov. 20) for work zone changes as part of the I-10 Broadway Curve Improvement Project. Westbound US 60 on-ramps at McClintock Drive, Rural Road and Mill Avenue closed. Westbound US 60 ramps to westbound I-10 closed. Westbound I-10 on-ramps at Elliot and Baseline roads closed. Allow extra travel time.
- Detours: Consider using alternate routes (including eastbound Loop 202 Santan Freeway or eastbound US 60) to reach northbound Loop 101 (Price Freeway) before detouring on westbound Loop 202 (Red Mountain Freeway) to approach Sky Harbor Airport or the downtown Phoenix area. Westbound I-10 drivers approaching Phoenix also can consider using the westbound/northbound Loop 202 (South Mountain Freeway) to reach I-10 in west Phoenix.
- Southbound SR 143 closed between Loop 202 (Red Mountain Freeway) and I-10 from 10 p.m. Friday to 10 p.m. Saturday (Nov. 18) for a traffic shift.
- Detours: Consider using westbound Loop 202 to eastbound I-10 (at the SR 51 “Mini-Stack” interchange) to reach destinations including the Sky Harbor Airport west entrance.
- Note: The westbound Loop 202 (Red Mountain Freeway) exit to Sky Harbor Airport near Priest Drive will be open.
- All east- and westbound US 60 on- and off-ramps at Mesa, Country Club and Stapley drives in the East Valley will be closed from 11:30 p.m. Friday to 11:30 p.m. Sunday (Nov. 19) for cross street pavement improvements.
- Detours: Consider using other nearby interchanges, including Alma School or Gilbert roads, to enter or exit US 60.
Schedules are subject to change due to inclement weather or other factors. ADOT plans and constructs new freeways, additional lanes and other improvements in the Phoenix area as part of the Regional Transportation Plan for the Maricopa County region. Most projects are funded in part by Proposition 400, a dedicated sales tax approved by Maricopa County voters in 2004.
Real-time highway conditions are available on ADOT’s Arizona Traveler Information site at az511.gov and by calling 511. Information about highway conditions also is available through ADOT’s Twitter feed, @ArizonaDOT.
Valley of the Sun Sold Listings
- 7050,7601,6318,6209,5731,5487,5833,5158,5583,4731,5817,6954
Information is deemed to be reliable, but is not guaranteed. © 2025
Valley of the Sun Inventory
- 19843,20237,20564,20332,20280,21356,23131,24233,23020,23573,25736,27535
- 9621,9474,8192,7689,8817,9001,9409,7451,6073,11120,10466,11294
Information is deemed to be reliable, but is not guaranteed. © 2025
Valley of the Sun New Listings
- 9621,9474,8192,7689,8817,9001,9409,7451,6073,11120,10466,11294
Information is deemed to be reliable, but is not guaranteed. © 2025
Valley of the Sun Pending Listings
- 7188,6637,5977,5646,5598,5649,5604,5050,4530,6303,6642,6494
Information is deemed to be reliable, but is not guaranteed. © 2025
Valley of the Sun Absorption Rate
- 3.32,3.37,3.45,3.46,3.44,3.65,3.96,4.11,3.88,3.93,4.28,4.57
Information is deemed to be reliable, but is not guaranteed. © 2025
Valley of the Sun Sale to Original List Price Ratio
- 96.1,96.2,96.1,96.0,95.6,95.8,96.0,95.8,95.3,95.4,95.8,95.8
Information is deemed to be reliable, but is not guaranteed. © 2025
Valley of the Sun Average Days on Market
- 66.0,64.7,65.2,66.8,71.1,70.3,71.9,71.1,75.7,81.5,80.0,77.6
Information is deemed to be reliable, but is not guaranteed. © 2025
Valley of the Sun New Listings Volume
- 6336656755,6070361412,4981802722,4528549389,5505279350,6181215417,6408533461,4990243000,3989362142,8348153311,7211801306,7764958223
Information is deemed to be reliable, but is not guaranteed. © 2025
National Real Estate News
Real Estate News in Brief
Lower than expected inflation figures for October convinced the market that the Fed is done hiking rates and may start cutting rates as early as the first half of 2024. Average 30-year mortgage rates have dropped significantly in recent weeks, from over 8% to below 7.4%.
Inflation Elation — Part I. The “headline” CPI (Consumer Price Index = inflation for you and me) was FLAT month-over-month in October, as falling energy prices offset higher shelter and food costs. On a year-over-year basis, “headline” CPI dropped to +3.2% (from +3.7% in September) and “core” CPI eased to +4.0% (from +4.1% in September). [Bureau of Labor Statistics]
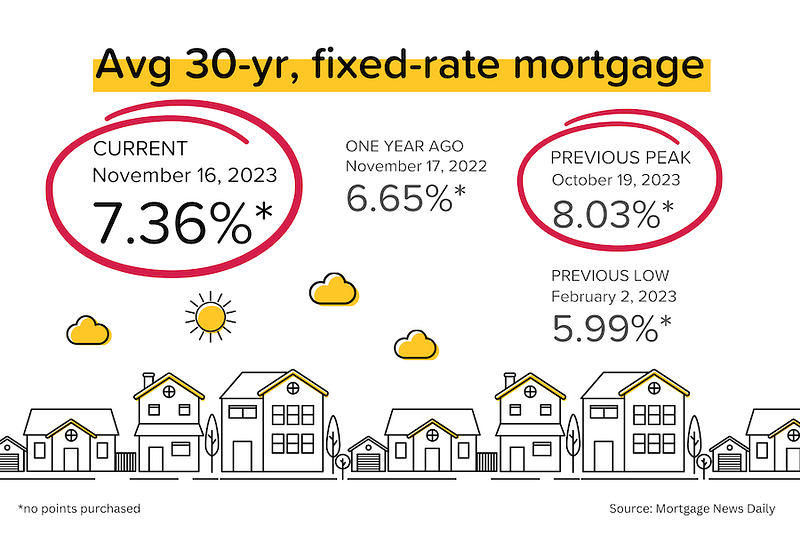
Party time for bonds. The lower-than-expected CPI figures ignited a major rally in bonds, with the yield on the 10-year US treasury plunging below 4.5%, and the average rate on a 30-year mortgage dropping to 7.36%. As a reminder, average mortgage rates were at 8.03% less than a month ago. [Mortgage News Daily]
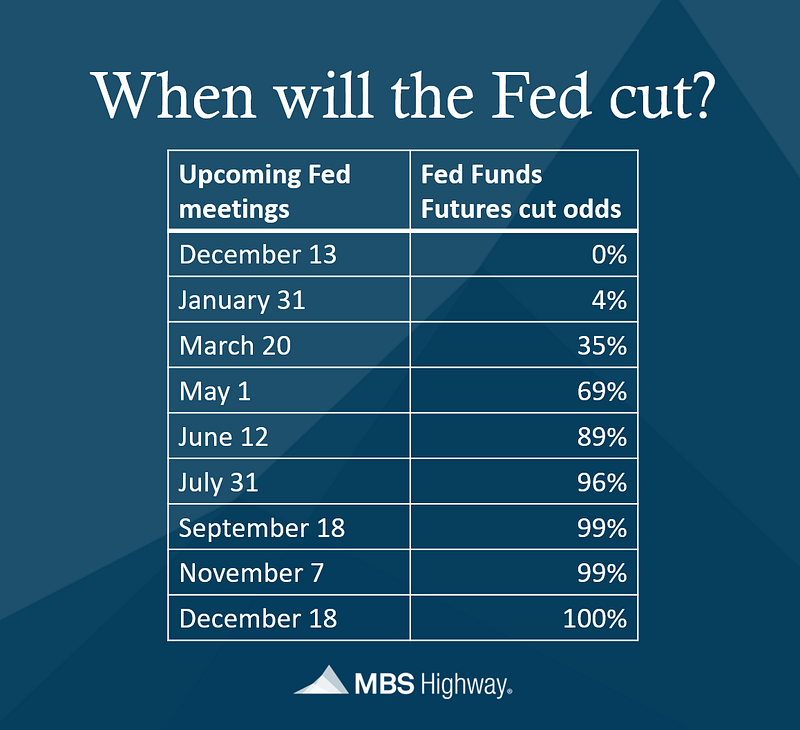
From hikes to cuts? Just before the CPI figures came out, the market was pricing in a ~30% chance of another rate HIKE in January. After the CPI figures came out, that swung to a small chance of a CUT. Looking further out, the market is now pricing in 4 rate CUTS before end-2024. Clearly the market doesn’t believe the Fed’s “higher for longer” rhetoric. [CME]
Inflation Elation — Part II. A day after the CPI came out, the BLS released the PPI (Producer Price Index = inflation for companies) and “headline” PPI dropped 0.5% month-over-month, bringing the year-over-year figure to just +1.3%. [Bureau of Labor Statistics]

Still shopping, not yet dropping. Retail sales fell 0.1% month-over-month in October, mainly as a result of falling gas prices. Remember: the retail sales figure doesn’t adjust for inflation. The result was actually a bit stronger than Wall Street economists were looking for (-0.2% to -0.3%). Retail sales excluding autos and gas rose 0.1% MoM. [Census Bureau]
More than just a seasonal slowdown. The MBS Highway Housing Survey for November showed a further slowdown in buyer activity as 30-year mortgage rates climbed briefly above 8% in October, and the prevalence of price reductions increased. Of note: a big drop in activity levels in the Northeast, and a potential bottoming in the Northwest, Midwest and Southwest.
Homebuyer pessimism. A record 85% of consumers said it was a “Bad Time to Buy” in Fannie Mae’s monthly Home Purchase Sentiment survey, and 78% said the US economy was “On the Wrong Track.” I would, however, point out that 65% of consumers thought it was a “Bad Time to Buy” in June 2021 and home prices have risen 20% since then.
Zillow’s October Housing Report. Home prices are falling month-over-month in most of the US as “mortgage rates at 23-year highs and the usual seasonal housing cooldown take their toll.” But home values are still up year-over-year in 34 of the 50 largest markets. Prices in Austin and New Orleans are down the most (both -9% YoY,) while Hartford CT (+11% YoY) and Milwaukee WI (+9% YoY) are up the most.
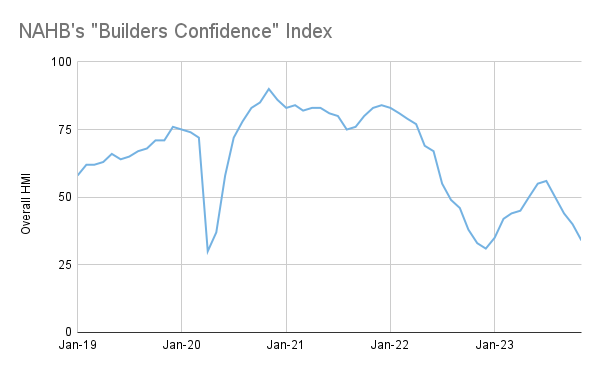
Builders are more bearish. The NAHB’s Housing Market Index (a.k.a. Builder’s Confidence Index) dropped to 34 in November (from 40 in October). Anything below 50 implies a contractionary environment. Why the long faces? Higher mortgage rates (for would-be buyers) and higher borrowing rates (for builders to finance projects.) It’s important to note, however, that the index was at 33 last November AND this survey won’t have captured the recent, sharp fall in rates.
NAR’s 2023 “Profile of Buyers and Sellers”
Every year, I look forward to this report coming out because it provides perspective on so many important topics in residential real estate. The report is based on a survey of buyers and sellers who transacted between July 2022 and June 2023. Here’s what I found interesting:
Buyers
- The typical home purchased was 1,860 square feet, had 3 bedrooms and 2 bathrooms, and was built in 1985.
- Buyers expect to live in their homes for a median of 15 years, with 22% saying that they were never moving.
- First-time buyers were responsible for 32% of purchases (up from 26% last year). That said, the average first-time % since 1981 was 38%.
- The typical home buyer had a household income of $107,000 (up from $88,000 last year). This reflects both higher home prices and a higher proportion of older buyers.
- The typical first-time home buyer was 35 years old.
- 19% of recent buyers were single females; 10% were single males.
- The typical down payment for first-time home buyers was 8%. For repeat buyers, the typical down payment was 18%.
- 95% of buyers aged 18–44 financed their purchase; only 57% of buyers aged 65+ financed their purchase.
- 71% of buyers only interviewed one real estate agent. 90% of buyers would use their real estate agent again.

Sellers
- The typical home seller was 60 years old.
- Sellers typically sold their home at 100% of list price, with one-third getting more than list price.
- 39% of sellers traded-up to a larger home, while 33% purchased a smaller home.
- 89% of sellers used a real estate agent to sell their home (up from 88% last year). 7% did FSBO sales (For-Sale-by-Owner) with 50% of FSBO sales going to people that the seller already knew.
- 87% of sellers said that they would ‘definitely’ recommend their agent for future services (14% said that they ‘probably would do the same.)
MBS Highway Housing Survey for November
The MBS Highway National Housing Index dropped to 31 in November 2023 from 35 in October 2023. In November 2022, the index was at 13.
Buyer activity slowed further, as average 30-year mortgage rates climbed briefly above 8%, and normal seasonality took hold. The National Buyer Activity sub-index dropped to 20 in November 2023 from 24 in October 2023, but remained above the 13 seen in November 2022.
Although competition levels have eased in recent months, the low inventory of homes available for sale has tempered the decline in the National Home Price Direction sub-index, which fell to 41 in November 2023, from 46 in October 2023. In November 2022, when home prices were falling month-over-month in most larger cities, the sub-index was at 12.
Regional Data
The most notable change in the regional indexes was the sharp decrease in the Buyer Activity index for the Northeast (67 in September, 45 in October and 30 in November). As a reminder, the Northeast and Mid-Atlantic regions have been both the most active and had the most positive price direction for most of 2023.
It also appears that the Northwest (+1), Midwest (flat) and Southwest (-2) regions are finding their floors, with their Buyer Activity indexes largely unchanged from October.
Similar to the trends seen at the National level, the regional Price Direction indexes are holding up much better. In both the Mid-Atlantic (60) and the Northeast (57), price increases still outnumber price decreases. The weakest pricing trends remain in the Northwest (28) and Southwest (34).

Life Happens
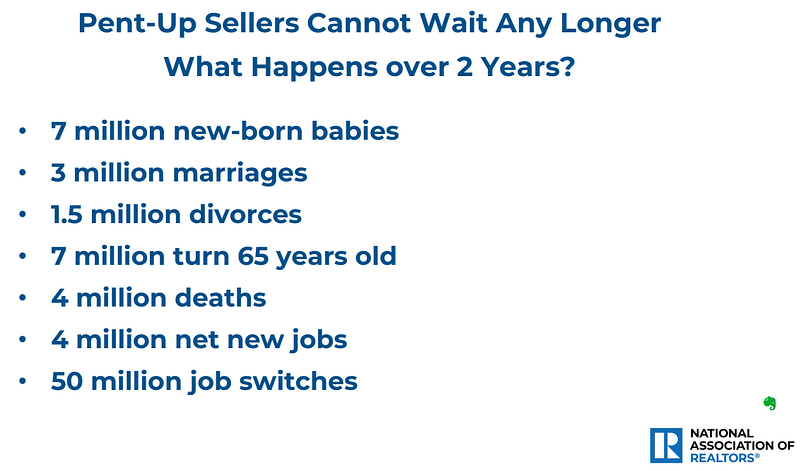
Nobody ever said, “Honey, I just can’t love you anymore with mortgage rates at 8%.” Similarly, people don’t stop getting married, having babies, switching jobs, or shuffling off this mortal coil because of what the Fed does.
I’ve previously compared US existing home sales to a spring. High mortgage rates and home prices have compressed the spring (kept existing home sales below their ‘natural’ level) for the last two years. But sales will eventually snap back, because millions of these important life events happen every year (see NAR slide below).
That natural rate of existing home sales is somewhere around 5.5 million units. In 2022, we sold 5.0 million units (-18% YoY.) In 2023E, we’ll likely end up with 4.1 million units sold (-17% YoY.) The NAR’s latest forecasts call for a 15% rebound in home sales in 2024E to ~4.8 million units, spurred on by mortgage rates of “6–7% by Spring 2024.”
Mortgage Market
In every tightening cycle, there comes a moment when the market no longer believes what the Fed is telling it. That moment seemed to be the release of the October CPI data. Let’s be clear: 1) the “beat” was not that dramatic, and 2) “core” CPI was still at 4.0%, twice the Fed’s target.
Notwithstanding the above, the bond market went into party mode. The yield on 10-year US treasury bonds dropped below 4.5%. The prices of mortgage backed securities jumped, and shortly thereafter, average 30-year mortgage rates were below 7.5%.
The market’s expectation for the path of the federal funds rate also shifted. Based on CME analysis of fed funds futures contracts, the market is now putting a 35% probability on a rate hike at the Fed’s March 20, 2024 meeting, and 69% probability of a rate cut at the May 1, 2024 meeting. All in, fed funds futures contracts are now implying 80–100 bps of cuts in 2024, starting as early as March.
They Said It
“The rise in interest rates since the end of August has dampened builder views of market conditions, as a large number of prospective buyers were priced out of the market. Moreover, higher short-term interest rates have increased the cost of financing for home builders and land developers, adding another headwind for housing supply in a market low on resale inventory.” — Alicia Huey, NAHB Chairman
“Pent-up sellers cannot wait any longer. People will begin to say, ‘life goes on.’ Listings will steadily show up, and new home sales will continue to do well. Existing home sales will rise by 15% next year.” Lawrence Yun, NAR Chief Economist
Here’s your links for this weekend’s events!

My Website always has a list of what’s upcoming. Go here and maybe I’ll see you out there!
|
|


|


|


|


|


|


|


|


|


|


|


|
|
|

|
|

|

|

|

|

Get your Home Value, wealth Snapshot and Ideas what to do with your Equity Every Month!

Join DeDe’s Secret Private Facebook group for tips, tricks, discounts and Freebies!

DeDe’s Social Media: Click on picture to read/watch


What’s Going on with DeDe?
Were you in Phoenix in the late 80’s and 90’s? The Sidewinders were a wonderful local (Tucson) band that should have made it big. After a lawsuit and a name change, they became the Sand Rubies. They were in town this week celebrating the 30th Anniversary of the Sand Rubies Album and I got to see them at the Valley Bar and scored their first release on LP (now spinning on my turntable)! What a wonderful experience!


The Kids had a ruff week. Visit to Papa, Visit to Uncle Jim’s house, supervising the landscaper and cuddling.


See you next Week!
DeDe